Physical Address
304 North Cardinal St.
Dorchester Center, MA 02124
Physical Address
304 North Cardinal St.
Dorchester Center, MA 02124


The stock market can be deceptively simple at first glance. Major indices like the S&P 500 move up, and conventional wisdom suggests it’s time to buy. They move down, and perhaps it’s time to sell or stay on the sidelines. But experienced traders know this surface-level analysis often leads to frustrating results and unexpected losses.
Why? Because the movement of an index only tells part of the story.
Behind every index rally is a critical question most traders fail to ask: How many individual stocks are actually participating in this move? This question is at the heart of market breadth analysis, and answering it can dramatically improve your trading consistency.
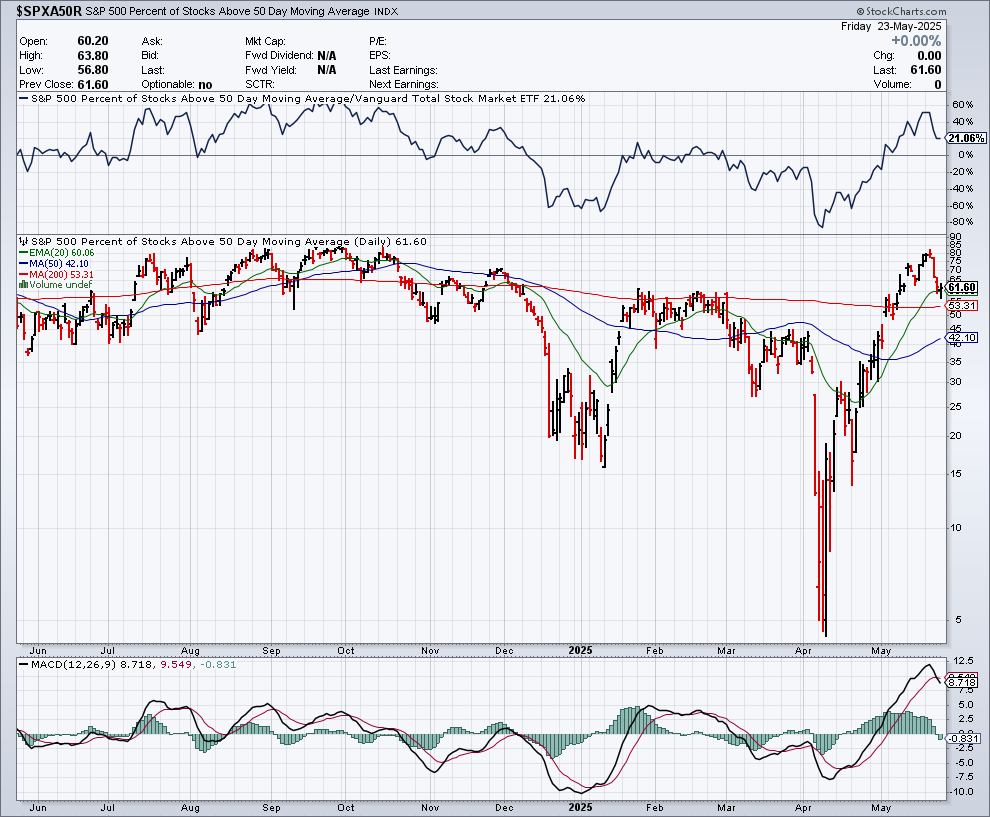
Today, I’m diving deep into one of the most powerful breadth indicators available to traders: the Percentage of S&P 500 Stocks Above Their 50-Day Moving Average. This single metric has saved me from countless false breakouts and kept me positioned correctly during genuine market opportunities.
At its core, this indicator is exactly what its name suggests: a calculation of what percentage of the stocks in the S&P 500 index are currently trading above their respective 50-day moving averages. It’s typically displayed as a percentage ranging from 0% to 100%.
Unlike the S&P 500 index itself, which can be disproportionately influenced by a handful of mega-cap stocks, this breadth indicator gives equal weight to each component. It answers a fundamental question: “How healthy is market participation right now?”
Think of it like this: The S&P 500 price is like a group’s average test score, while the % Above 50-Day MA shows how many students actually passed the test. A high average can hide a troubling reality if only a few top students are skewing the curve.
Ever jumped into what looked like a strong market rally, only to watch it fizzle out the next day? Or stayed cautious during a seemingly weak market that suddenly reversed higher? These frustrating scenarios often occur because traders rely solely on price action without confirming internal market health.
The % Above 50-Day MA serves as a crucial filter that can help you:
In my experience, this indicator has been invaluable for answering a critical daily question: “Is this a good environment for my trading style right now?” For active traders, this insight alone can mean the difference between consistency and frustration.
Accessing this powerful metric is straightforward:
For additional context, I recommend displaying this indicator alongside the S&P 500 index (SPX) to see the relationship between price and breadth. You can create a chart layout with both for easy daily reference.
Alternative sources for this indicator include:
The beauty of this indicator lies in its clear interpretation. Based on years of market observation and historical patterns, here’s how to read the signals:
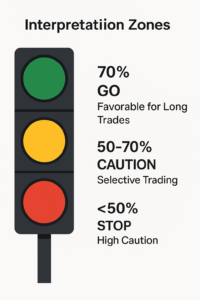
When over 70% of S&P 500 stocks are trading above their 50-day moving averages, it signals robust market health with broad participation. This environment typically supports:
In these conditions, I’m more comfortable taking larger position sizes and holding trades longer, as the market tide is lifting most boats.
This middle range suggests reasonable but not overwhelming market health. The environment is mixed, with some sectors showing strength while others lag. During these periods:
When the indicator sits in this range, I’ve found success focusing on best-of-breed stocks in the strongest sectors rather than casting a wide net.
When fewer than half of S&P 500 components are above their 50-day MAs, it reveals significant underlying weakness, even if the index itself hasn’t declined dramatically. This often indicates:
I’ve learned the hard way that trading long in these environments often feels like swimming upstream. For most traders, reducing exposure, tightening stops, or focusing on short-term trades is prudent until market health improves.
While the percentage readings provide excellent baseline guidance, sophisticated traders can extract even more value by examining:
How quickly is the indicator changing? Rapid moves from low to high readings often signal powerful new uptrends. Conversely, a swift decline from high levels frequently precedes significant market corrections.
When the S&P 500 makes new highs but the % Above 50-Day MA fails to confirm (making lower highs), it signals diminishing breadth and often precedes market tops. In my trading, these divergences have provided some of the most reliable warning signs to reduce risk exposure.
Readings above 90% indicate potential short-term overbought conditions, while readings below 20% often signal oversold conditions ripe for bounces. However, remember that extremes can persist in strong trends, so always confirm with price action before countertrend trading.
For more nuanced analysis, examine this same indicator across different sectors. Often, sector rotation appears in breadth before becoming obvious in price, giving you a potential edge in positioning.
Let’s examine how this indicator helps avoid three common trading traps:
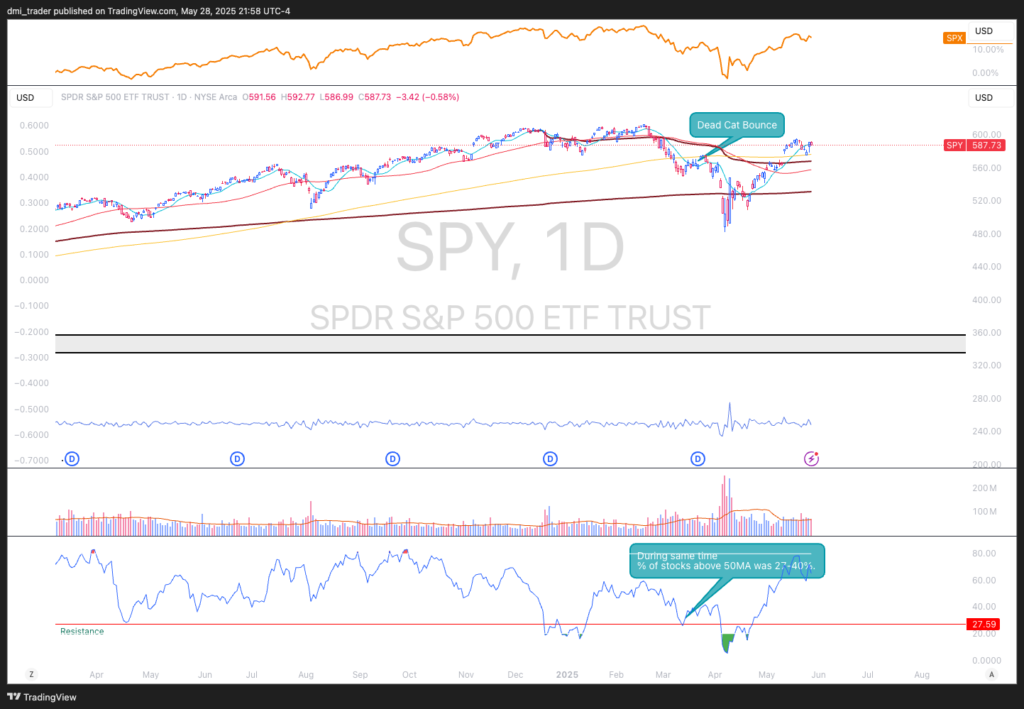
After a significant market decline, indices often stage sharp rallies that lure in hopeful bulls, only to resume their downtrend. These rallies typically occur with breadth readings below 50%, signaling they lack broad participation.
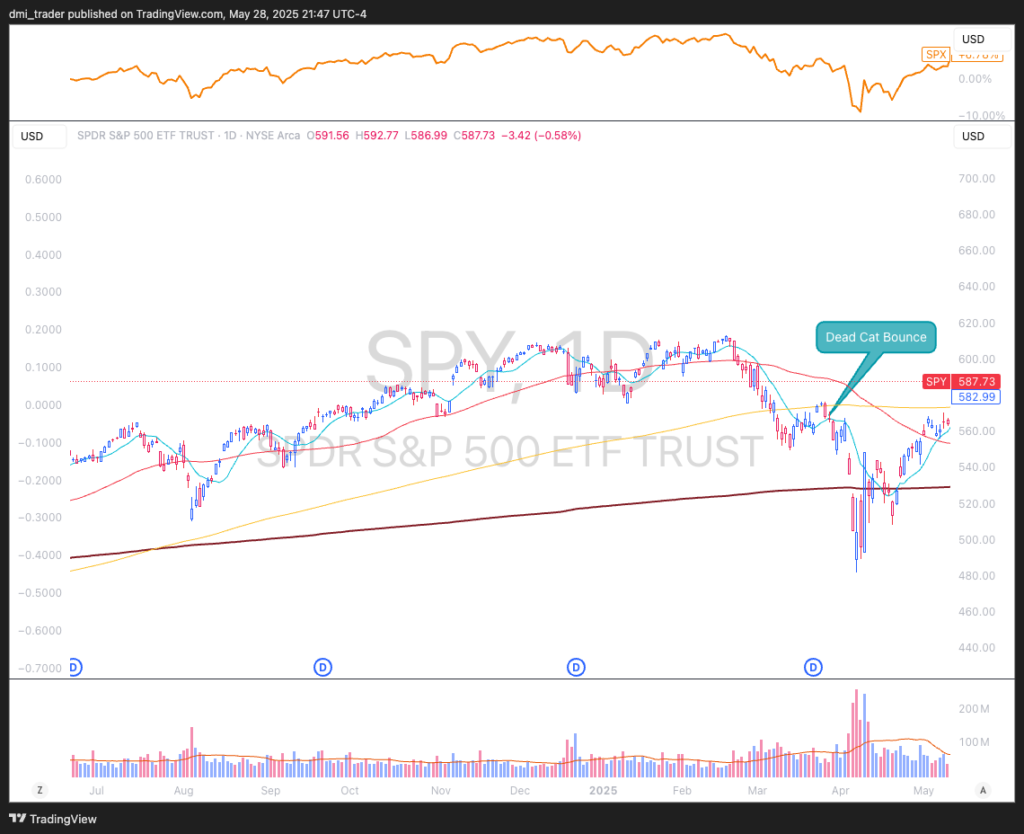
In my experience, when the market bounces but the % Above 50-Day MA remains below 40-45%, these rallies frequently fail. By waiting for breadth confirmation above 50% before committing to long positions, you can avoid many of these painful false starts.
Sometimes the S&P 500 will appear to be in a healthy uptrend, but underneath the surface, fewer and fewer stocks are participating. This narrowing leadership often precedes corrections.
I’ve noticed that when the index makes new highs but the % Above 50-Day MA falls below previous readings (creating divergence), subsequent selling often follows. This scenario frequently occurred during the late stages of the 2021 bull run, offering early warning signs for attentive traders.
Many traders hesitate to enter positions during early-stage uptrends, only to finally commit after seeing extended price gains. Unfortunately, this often coincides with extreme breadth readings above 85-90%, suggesting the easy money has already been made.
By tracking breadth recovery from low levels (like 20-30%) to above 50%, you can identify emerging uptrends earlier, potentially entering positions when risk/reward is more favorable.
To maximize the value of this breadth indicator, I recommend incorporating it into your pre-market routine:
Want to simplify this process and get a clear Go/Caution/Stop signal every day?
Our FREE Daily Market Readiness Scorecard provides the exact indicators and easy-to-follow steps you need. It even tells you where to find the data!
👉 Get Your Free Scorecard & Start Trading Smarter Today!
Based on the reading, make specific adjustments:
At market close, reassess the indicator to see if anything has changed significantly. Often, major market turning points are accompanied by significant shifts in this breadth measure.
This simple process takes just minutes but can dramatically improve your trading results by ensuring you’re aligned with the market’s underlying health rather than just its price action.
While powerful on its own, the % Above 50-Day MA becomes even more effective when combined with complementary breadth measures:
I’ve found that when multiple breadth indicators align, the signals become significantly more reliable. For a comprehensive assessment, consider reviewing all three of these metrics as part of your Daily Market Go/Stop Guide routine.
Before implementing this indicator, be aware of these common misconceptions:
“It’s a timing indicator for exact entries and exits.”
Reality: It’s a filter for market conditions, not a precise timing tool. Use it to determine whether to trade aggressively, not exactly when to enter specific positions.
“Extreme readings always mean imminent reversals.”
Reality: In strong bull or bear markets, extreme readings can persist far longer than expected. Always respect the trend until breadth actually begins to shift.
“It works the same in all market environments.”
Reality: During highly unusual conditions (like March 2020), traditional interpretations may need adjustment. Always consider the broader context.
The Percentage of S&P 500 Stocks Above Their 50-Day Moving Average isn’t just another technical indicator—it’s a window into the market’s true health that most retail traders never consider. By incorporating this powerful breadth measure into your daily routine, you gain critical context that can help you:
I believe that understanding market breadth is one of the most underrated skills that separates consistently profitable traders from the struggling majority. From my experience, ignoring breadth indicators has often led to frustrating whipsaws and avoidable losses, especially during transitional market periods.
Start tracking the % Above 50-Day MA this week, and you’ll likely notice patterns in your trading success that correlate directly with these breadth readings. Use it as your market traffic light, proceeding with appropriate caution or confidence based on what it tells you about underlying market health.
Remember: Trade with the tide, not against it. Your trading account will thank you.